What happened in the travel world during 2022? End-of-the year analysis
The year is coming to an end and you know what that means: End-of-the year analysis! We wanted to know how destinations performed this year compared to 2021, which had better results and which had worse. In this article we will analyse changes in Image Rankings, budget, travel factors, and more!
Destination Image Rank
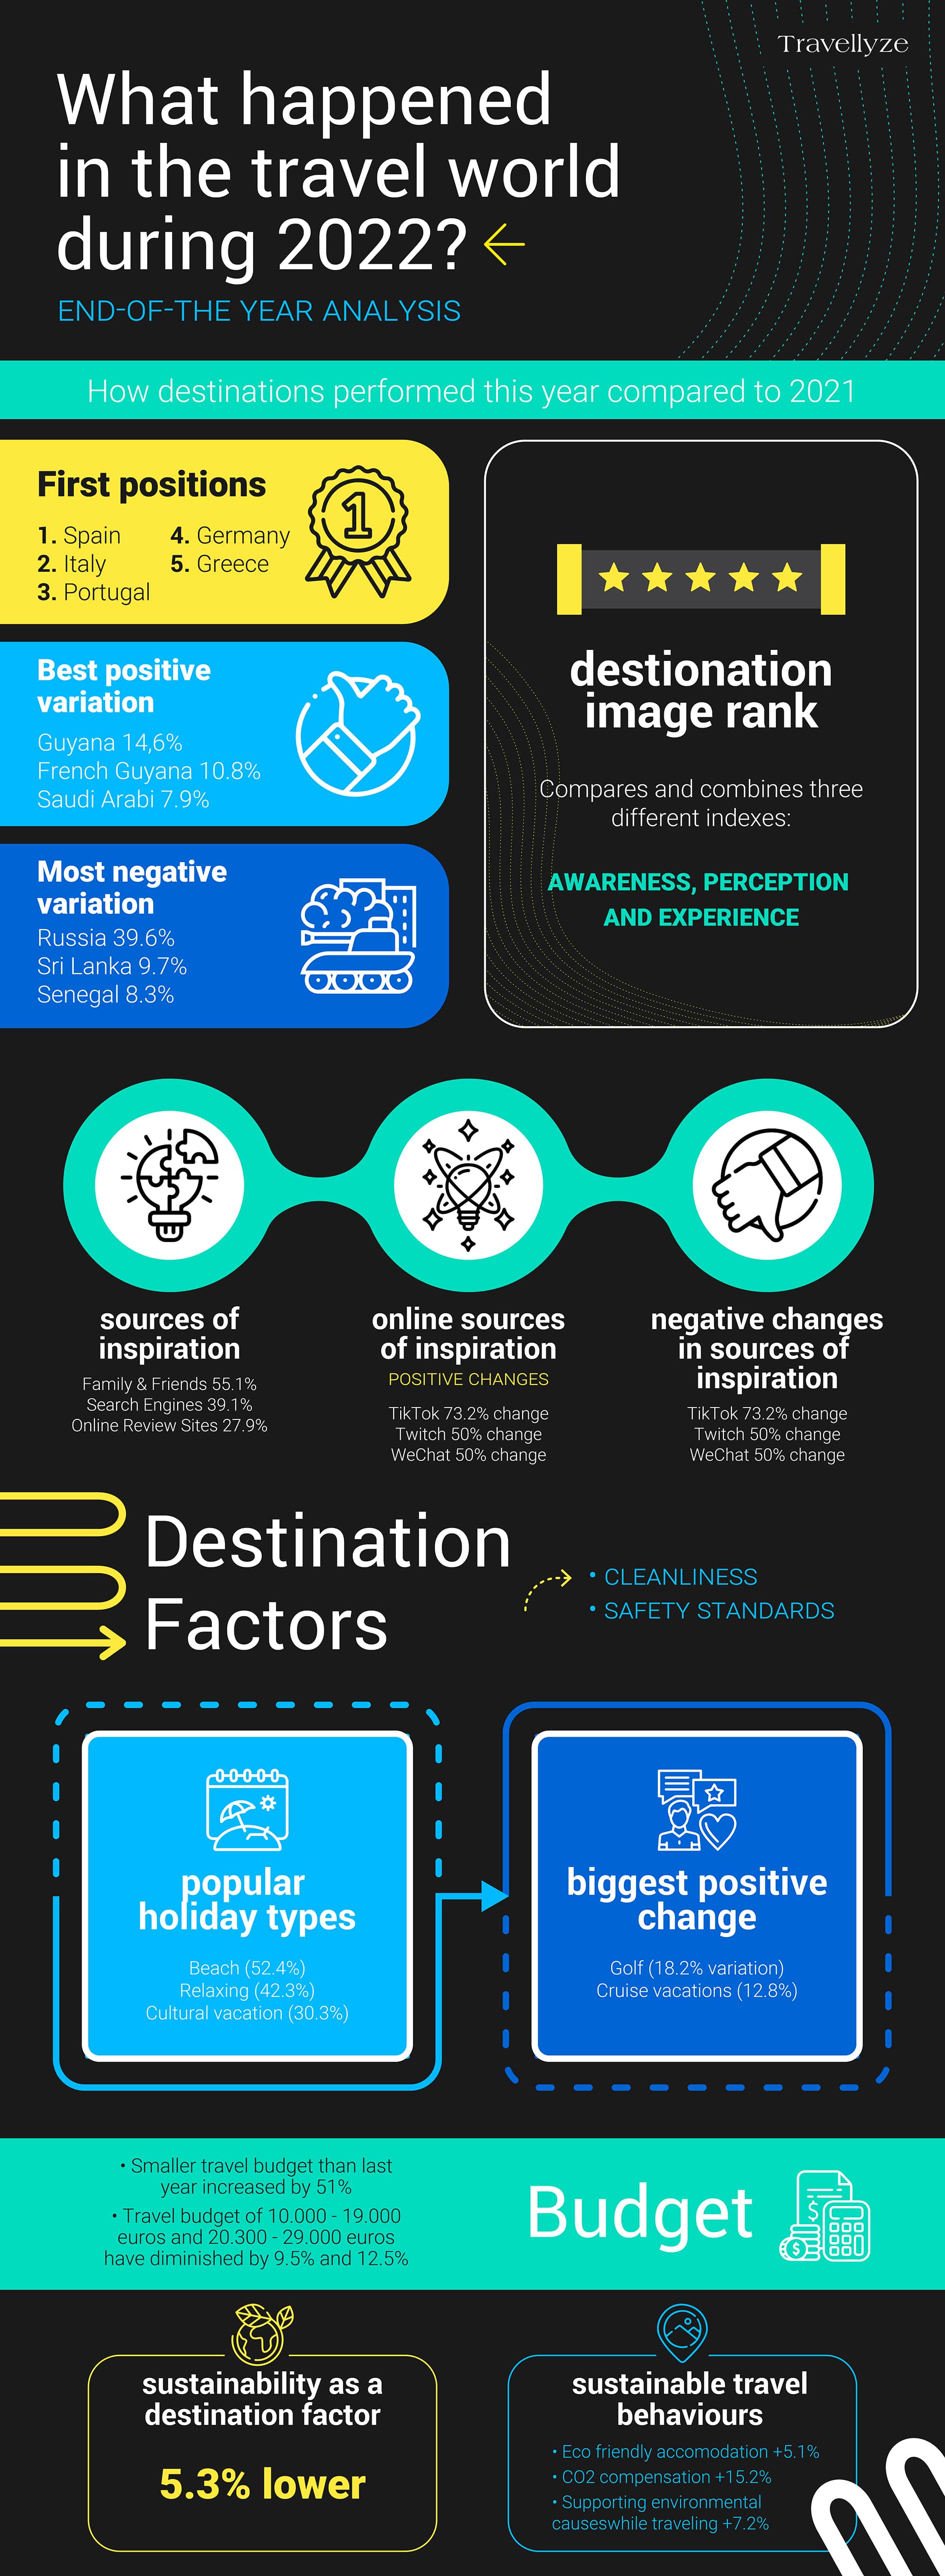
Our Image Ranking is based on a comprehensive algorithm that compares and combines three different indexes: Awareness, Perception and Experience. The result is a global scoring for the overall image of a destination, which makes it really easy to compare with previous years.
When we look at this year's Image Rank, we notice that the first positions haven't changed much. The 3 destinations with the highest scores remain Spain, Italy and Portugal, classic European powerhouses. We also observe that, compared to last year, their score has faced a slight negative variation in between 0.8% and 1%.
But what about those that have seen the biggest change in their scores since last year? As for the destinations with the more relevant positive variation, we find Guyana as the leader with a 14.6% change. Other destinations that performed well were French Guyana (10.8%) and Saudi Arabia (7.9%). A great year for the Guyanas!
As for those that faced the most relevant negative variations, Russia leads the ranking with a 39.6%, a clear consequence of the Ucranian War. Other destinations with relevant negative changes were Sri Lanka (9.7%) and Senegal (8.3%).
Travel inspiration, destination factors and holiday types
Sources of inspiration are very relevant when planning a marketing strategy for your destination. In 2022 the 3 most relevant sources were Family&Friends (55.1%) , search engines (39.1%) and online review sites (27.9%). We also noticed a great growth in online sources of inspiration like TikTok (73.2% change), Twitch (50% change), and Wechat (50% change). This growth is related to the negative change in print media inspiration sources like newspapers and supplements (11.4% change) and lifestyle and travel print magazines(10.9% change).
As for destination factors, the most important by 2022 are cleanliness and safety standards.
The 3 most popular holiday types in 2022 were sun and beach (52.4%), relaxing (42.3%) and cultural vacation (30.3%). As for those with the biggest positive change, golf leads the ranking with an 18.2% variation, followed by cruise vacations with a 12.8% variation.
How inflation affected travel budgets in 2022
Increased inflation in the European community has affected most industries and tourism is no exception. We notice that the amount of people that have a smaller travel budget than last year has increased by 51%. We also notice that travellers with travel budgets of 10.000-19.0000 euros and 20.000-29.000 euros have diminished by 9.5% and 12.5%. Related to this topic, we also notice that affordability as a travel factor has increased its relevance by 7%.
Climate change: What happens with sustainable travel?
Sustainability is quickly becoming an important factor in purchase decisions in all industries, but what about travel? When we observe the variation in the relevance of Sustainability as a destination factor, we notice that it has diminished by 5.3%. But if we analyse sustainable travel behaviours, we can see that the results are different:
- Choosing eco friendly accommodation has increased by 5.1%
- CO2 compensation has increased by 15,2%
- Supporting environmental causes while travelling has increased by 7.2%
Destination with the best image score: Spain
Spain leads the ranking as the country with the highest awareness and highest positive experience. This ranking is composed of Spain, Italy, Portugal, Germany and Greece.
This is due to the fact that tourists who choose it as a tourist destination value the cleanliness, the safety standards and low crime levels and the varied agenda of festivals, concerts and events. Also because it offers the 3 most popular types of vacations: sun and beach holiday, with a choice of 52.3%, cultural holiday, with 39% of the choices and relaxing holiday, with 37.2%.
Delving into some of the preferences of european travelers who choose this wonderful country, it is important to mention that they prefer it during the months of october and december for vacations of less than 4 days and during july and august for vacations of more than 5 days, choosing 3-4* hotels.
Conclusion
This analysis has shown several interesting insights. We have learned that the destinations with the biggest growth in their image score are Guyana, Saudi Arabia and French Guyana. Also, as a consequence of the Ucranian War, Russia has significantly lowered its score. We also noticed a big growth in online inspiration sources like TikTok and Twitch and a decline in print media like newspapers and magazines. Another relevant insight is the effect of inflation on the travel industry. The amount of people with a smaller travel budget increased by 50% in 2022.
How are you analysing your performance during 2022? Our data can help you!

